GraphCraft: Jack Smith's October Surprise
Graphing the filing's revelations with Maltego.
MAGA Meldtown Movements (2024-02-06) was the first time this year I opened the big Maltego graph I’ve been keeping, due to some movement around Truth Social’s parent company, Trump Media & Technology Group. I’ve had it open more or less monthly since then, and this week’s massive filing by Jack Smith demands attention.
Today we are going to walk through what I did with this material and at the end there will be Maltego graph files you can download and inspect on your own.
If you’ve recently joined and never touched Maltego you should look at the video in Actual Maltego Link Analysis. This application is a penetration tester’s toolkit that is evolving towards more general link analysis and it’s frightfully complex to master, but if you want to follow along it’s pretty easy. You can get the free Maltego Community Edition or CaseFile, which is Maltego minus the ability to run transforms (queries), which would not have a big effect in this case.
Attention Conservation Notice:
This has turned out to be almost entirely “GraphCraft”, which means not just how to use Maltego from a mechanics viewpoint, but about the decisions one makes in terms of what to include, and how to maintain it. There will be some sort of “statement of findings” on a future article about the October Surprise, but anything labeled “GraphCraft” will be specifically for Maltego wranglers.
Starting Point:
There were a total of seventy unique names in the new filing. Key players, like Mark Meadows, sometimes had two different numbers. There were several names that were new to me, people whose names have not appeared in reporting, like the White House photographer, and there were a couple deputies to political players that were also unfamiliar.
I chose to call this update SURPRISE, and each person received a label based on that - SURPRISEP1 is Steve Bannon, Meadows first appears as SURPRISEP21. If you have the Maltego graph open you can use ctrl-f to search, and then adjust the search bar at the bottom to include notes. In retrospect I wish I’d used P01 - P09 for the first nine, as searching for them brings up entities with two digit numbers beginning with a one.
Once that was done I used cltr-f to search for SURPRISE, then chose Add Neighbors, and this got me the additional 830 entities. I loaded the filing to Document Cloud, named it Jack Smith’s October Surprise, and used a link to that URL to tie all seventy together.
Let me offer a bit of GraphCraft here - that is probably going to be an excess degree of aggregation, a point in the middle with more weight than it deserves, which tugs the rest of the graph out of shape. If you look at the first graph you can see a cluster around Clark, Eastman, and Giuliani, the blue lines are alliances, the rest are conflict. Those involve actions and attitudes as reported, not the fact that they were in the same report. As I enrich this graph by reading the document and filling in additional links showing interaction between people, there is a very good chance I’ll remove the filing itself, and let the SURPRISE label in entity notes serve as the means for me to select them all at once.
This is what happens if I delete the filing as the central node in the graph - a few of these people I had no context for so they’re loose from the rest.
Cleanup:
The first thing I did when I set out to further enrich this graph was to remove THIS mess. I had hoped the “conduits” Eastman mentioned as his paths to Trump would eventually be enumerated. They have not and that’s six nodes in a very full graph that can be removed.
Here’s another bit of GraphCraft that I’ve long debated removing. I have transcripts of the first 2,000 episodes of Steve Bannon’s War Room and I know the names of the roughly 170 individuals who appeared. This isn’t a particularly valuable grouping in terms of insight. I could rig up a CSV file of names and episodes, but adding 2,000 additional nodes would exceed the 10,000 node limit for my Maltego license. I’ve used the name/episode data with Gephi, which I enjoyed, but which didn’t really surface anything new. The problem there is the shows are eclectic within even one episode, they’ll bounce around between issues, so an episode is not a natural topic boundary.
Here’s another bit of GraphCraft you need to know - Maltego is a link analysis tool, but the MAGA Meltdown file would be more correctly described as a sort of ersatz graph database. The enormous forest of entities and links obscures rather than illuminates - it is NOT for visualization. The value in this thing comes when I need to pull out a subgraph so I can visualize what relationships exist.
There are some entities that have been named so frequently in the 1,500+ articles that are included as citations that I’ve taken to the military norm of appending “Actual” to the entity’s node in order to be able to find them. There are 149 entities that qualified for this treatment, here are a sample of them.
Here’s another aspect of the main graph that will remain, but it’s getting under foot for this one. The 65 Project is a bipartisan group of lawyers who came together to compel punishment via the Bar Associations in each state where the Trump campaign’s lawyers filed frivolous litigation. I am proud to have been able to employ Disinfodrome to add a tiny bit of content to one of those complaints, but in this context it being 39 of 900 nodes that adds nothing to the effort.
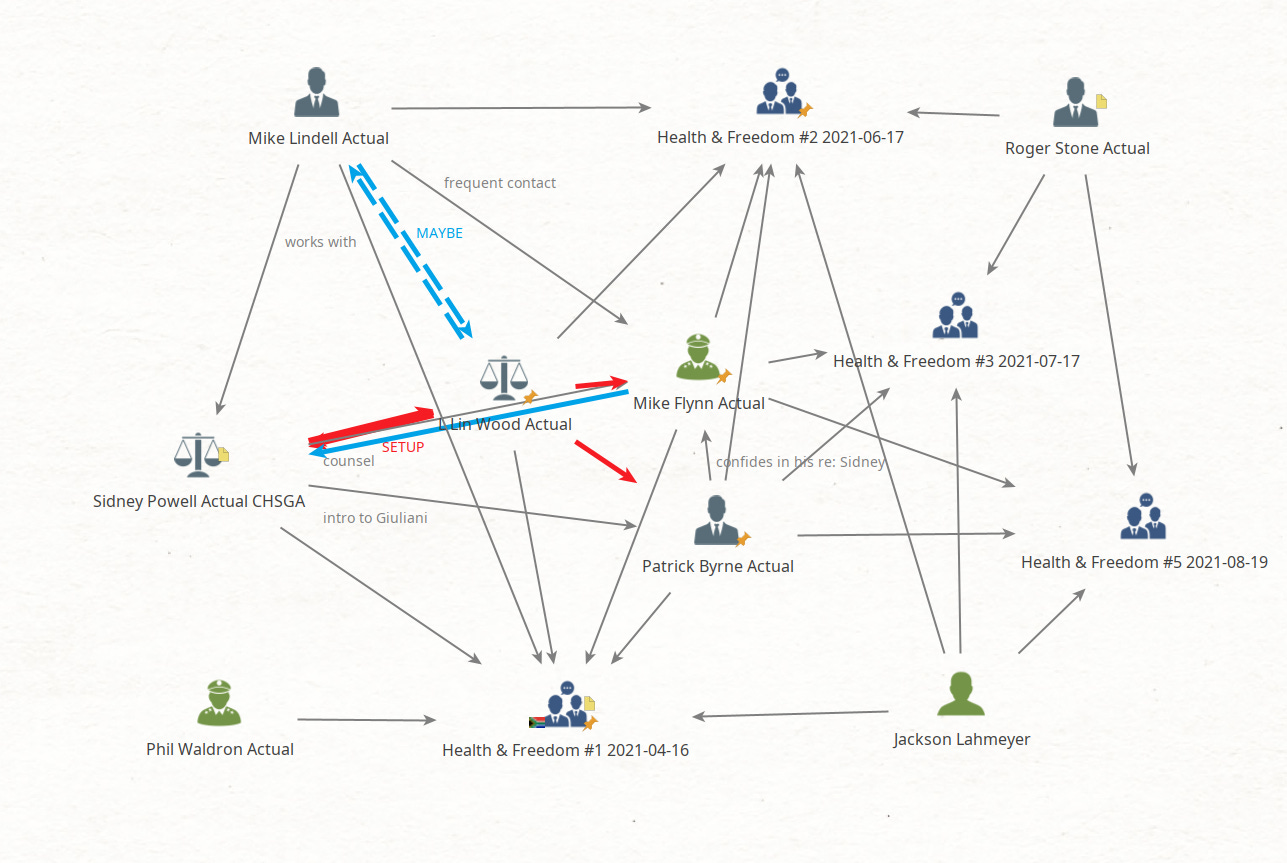
Here’s yet another aspect that needs to go - there are forty four meetings that were attended by the seventy named individuals. What you see here are two individuals in the filing - Roger Stone and Sidney Powell, who attended a total of four Health & Freedom tour events. The other five on here aren’t in the filing, but they have some relationship with someone who is, which is why they’re visible in this facet of the graph. What we need in this exercise is ONLY meetings that had to do with the five different conspiracies that were in effect for January 2021.
This is a judgment based iterative process that goes until the graph database thing at the start gets slimmed down to a tool that is suitable for understanding a specific aspect. I can update that graph, then when I’m satisfied with the changes I can merge the changes into the main graph. This is accomplished by selecting all the nodes, choosing Copy As GraphML, and pasting this into the main graph.
Enrichment:
Three hours later, this is what I had for a graph - 152 entities, 190 links. I started with 70 SURPRISE entities but now I’ve only got 69. The one that was lost must have been a “leaf”, someone who has no other connections than being in that list of names. I could go all autist here and hunt it down, but I’m going to let it slide. This graph is NOT reality, none of them really are, they’re just a map of the territory. As we saw in Cleanup section, there were judgment calls in the moment that I later come to regret. When pulling a subgraph from the main in order to share it with someone else there is almost always a bit of cleanup to be done before it’s ready to go.
That’s still visually messy, so here are just the six co-conspirators, eight people in the filing with whom they interacted, nine others who played roles but who were NOT in the filing, ten meetings, and eleven incidents. Seventeen of the twenty four people here are lawyers. Names with red underlines are co-conspirators, those with a blue line above are seven who had their phones seized via search warrant.
Getting down to this level, 150 entities or less, is key for visualization, no matter if you’re using Maltego or Gephi. Humans evolved from hunter gatherer bands to small villages and we’ve got a wetware limit of around 450 people we can know in some degree of detail. I think this also effects the maximum effective entities on a graph being one third of that amount.
Now we have a useful level of detail, it permits us to start to be able to characterize events, maybe even reason about them a bit, and around 50 it becomes much simpler. I just checked, the 152 node network image isn’t very legible as a Substack image, but the one with just the core 47 entities is.
Having built the big graph by hand means that I read, with some assistance from IBM’s Watson, the 1,562 citations in it. A rough estimate on this … three million words. This gives me a bit of a leg up on those of you who are just arriving. This is what I see when I focus on the smaller graph.
Four of six co-conspirators had their phones seized; DOJ knows SO MANY things we do not.
Powell is nuts, that’s been widely reported, her broader activities based on conspiracy theories exposed her.
Chesebro was the under-appreciated architect of some of the plans, and his COMSEC was piss poor - using email from what should have been phone calls, denying he had a Twitter account, which was easily found - he really thought he had a sure fire plan.
Scott Perry’s phone was seized, he was absolutely instrumental in the runup to the insurrection, but no charges; DOJ is studiously avoiding House members, despite more than a dozen obviously needing attention.
Maltego Files:
This article and whatever additional episodes I produce are going to require that you install Maltego. Sorry, you must be “can install and use Maltego” tall to ride this ride.
Jack Smith’s October Surprise Files
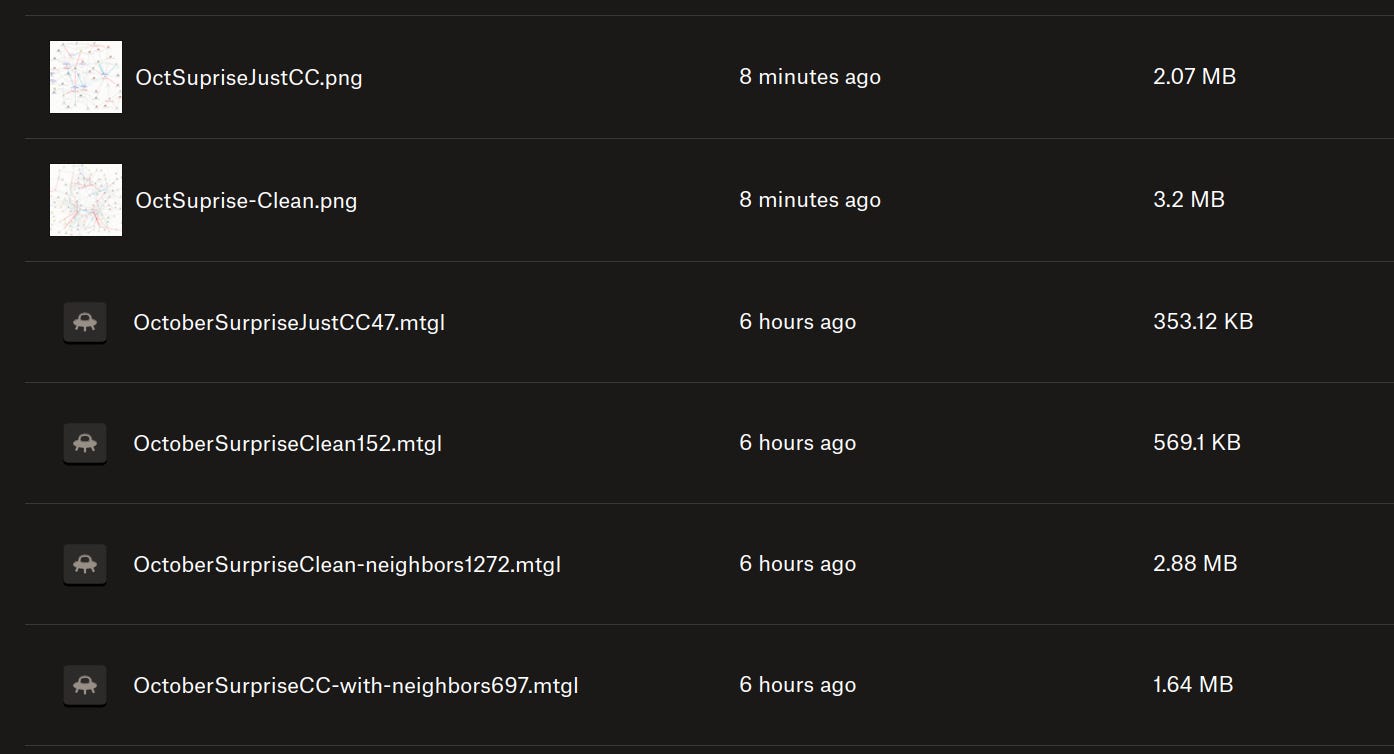
So what you have there are the full resolution images I used in this article, the actual Maltego files that correspond, and then the last two are those files with the neighbors from the main graph. This is why you need those files.
What I did here is ctrl-f and search for “SURPRISECC” to select the six entities, then I pulled them below the body of the graph. Next I selected just the URLs and dragged them to the left. Those six individuals have been mentioned in 291 citations that made it into the main graph. The stuff on the right are all of the various entities that are related.
Any link that you see on a subgraph I’ve produce using the master MAGA Meltdown graph can be verified by checking the articles in the URLs. Here are the source sites and counts for the top twelve.
59 https://washingtonpost.com
35 https://the65project.com
34 https://documentcloud.org
29 https://twitter.com
12 https://nytimes.com
9 https://politico.com
9 https://emptywheel.net
8 https://january6th.house.gov
6 https://thedailybeast.com
5 https://rollingstone.com
5 https://motherjones.com
5 https://buzzfeednews.com
Twitter in aggregate is a right wing disinformation op, but there are individuals and organizations who do good work. When a tweet gets included it’s generally “connective tissue” - there’s some additional context in it that is not available in an article.
7 https://twitter.com/January6thCmte
4 https://twitter.com/visionsurreal
3 https://twitter.com/the_peetape
2 https://twitter.com/rgoodlaw
2 https://twitter.com/capitolhunters
1 https://twitter.com/TheeRougarou
1 https://twitter.com/ScottMStedman
1 https://twitter.com/Santucci
1 https://twitter.com/ryanjreilly
1 https://twitter.com/PiperK
1 https://twitter.com/nytimes
1 https://twitter.com/maggieNYT
1 https://twitter.com/lukebroadwater
1 https://twitter.com/kylegriffin1
1 https://twitter.com/cjcmichel
1 https://twitter.com/alex_mallin
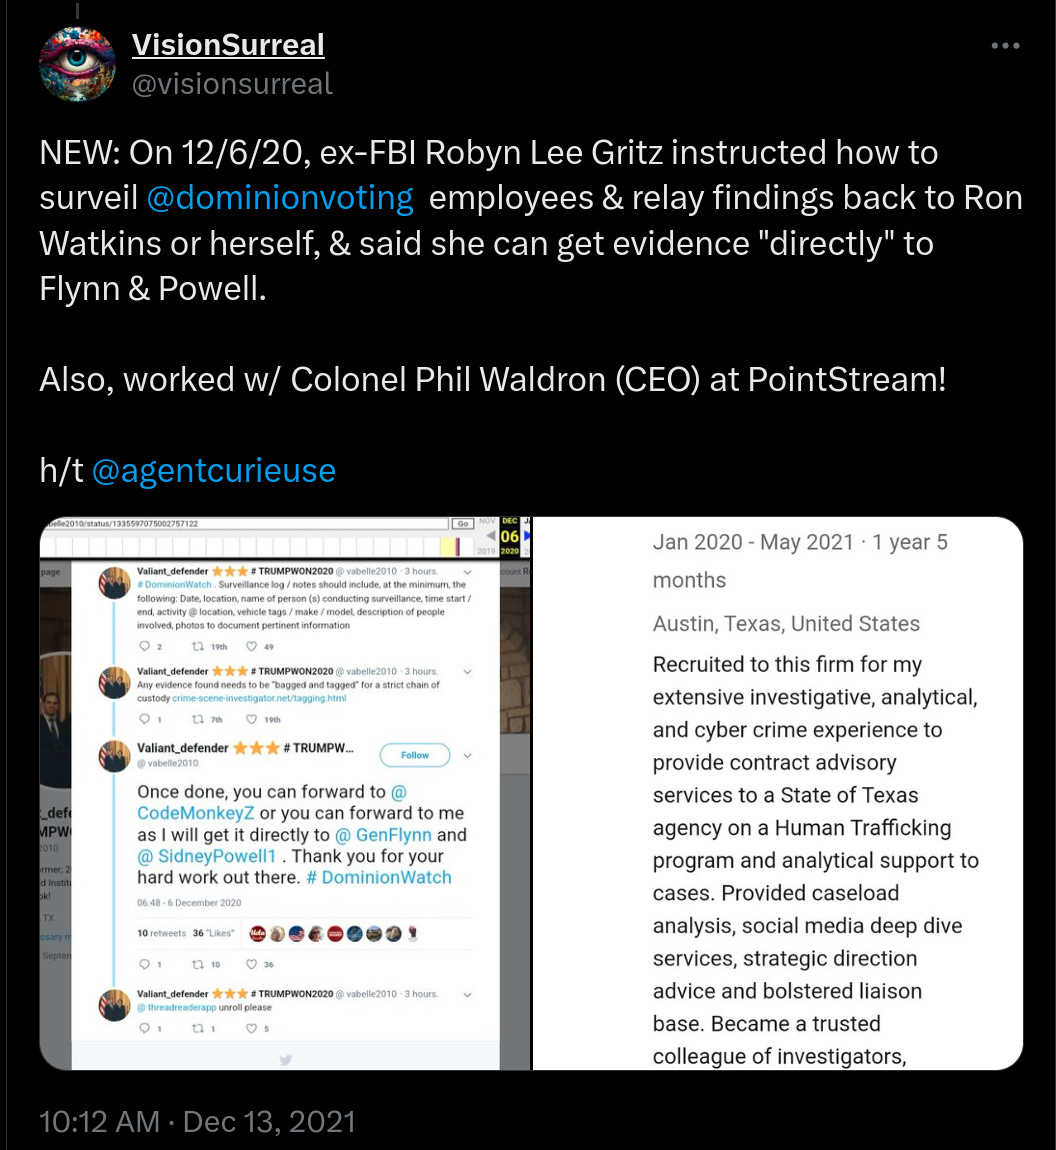
This tweet by visionsurreal is an excellent example of the caliber of content required to make the collection. This shows statements by Robyn Lee Gritz about providing data to 8chan admin Ron Watkins, so they can get it “directly” to Mike Flynn and Sidney Powell. Phil Waldron, also mentioned, was instrumental in Giuliani’s attempts to game the Georgia state senate.
Conclusion:
When I started this I thought it would be a hybrid of Maltego use and conclusions. Slowing down on the graph updates enough to describe what I was doing caused me to slow down even more, and this morphed into a piece on Maltego use doctrine.
While I’ve been spending time on this detailed update to a four year long curation effort, I think it’s worthwhile to mention what has been happening in the periphery.
October Observation Opportunities is all about things that have happened, or are about to happen, due to careful curation, and some of this still requires attention to ensure things are moving along.
There are hints in OOO about social media drama which I am ignoring for a minimum until after the election, more likely till after the inauguration, and with any luck I’ll never have to look too closely.
I am in dire need of another Flying Monkey Morning Report, but my favorite nosy aerobatic primate has this thing called a “life” and I can’t expect to see them much until mid-month.
Two different associates, one I hear from monthly, and the other annually, both turned up with their own need for a flying monkies, providing some additional validation that everything in the world is moving all at once.
September was a month for IRL unpleasantness, with a long illness reaching its natural end, minor difficulties leading to the cancellation of a long overdue minor surgery, a problem resulting in a hospital stay and some significant aftercare, an old, tired vehicle that’s going to sit until a four digit repair can be accomplished, a client who has been wavering in the economic headwinds finally succumbing, and probably a dozen other lesser insults I won’t enumerate.
My stupid iPhone, which spends 99 & 44/100ths of its time either sitting on my desk, or riding in my backpack when I go out, got in touch with its feline nature, and managed to hide under a cart in the laundry room for thirty six hours. I do not like and did not appreciate learning precisely how dependent I’ve become on a carrier phone number tied to various things.
It’s a mad, mad, MAD world out there and if you can manage it Q4 2024 would be a great time to get into focusing on what’s important, rather than what is merely urgent.


