Disinfodrome Adds Datasette Hosting was the first public mention of something that’s been in the works for a while. We already handle large volumes of documents with Open Semantic Search and now we’re going to be dealing with large volumes of tabular data with Datasette.
The other day I asked for a show of hands on various Python IDE (Integrated Development Environments) and as a Pycharm user I was the odd man out - everybody else was using VSCode. Given that there are now half a dozen people with varying development skills in that one chat room over there, I gritted my teeth and installed it.
One of the things that thwarts deeper journalism with leaks is the fact that tables are, at least to some a degree, normalized. What’s good for computers is the antithesis of what humans who read and write need.
The Heritage Wordpress data dump was of the right size to use as an example. As an example of what might happen, the wp_users table has all the stuff a human reader would think of in terms of a user, name, creation date, email, and the like. There are other places in the system where interesting information associated with a given user has only the user’s numeric ID associated with each item. That’s easy and efficient for a computer to handle, but maddening for a human who has to keep cross referencing numbers.
What you see below is the start of an Entity Relationship Diagram, a visual means for a human programmer to represent a database structure. I restored the Heritage data to a local MySQL database and then used this command to extract the overall structure.
mysqldump --no-data pantheon > pantheon.sql
This Gist contains the full Heritage SQL schema - again, something a computer would use, but a human not so much.
There’s a nice tool for making ERDs that works with both Pycharm and VSCode - it’s called ERD Editor. This is what I see after making a blank ERD and importing that SQL schema.
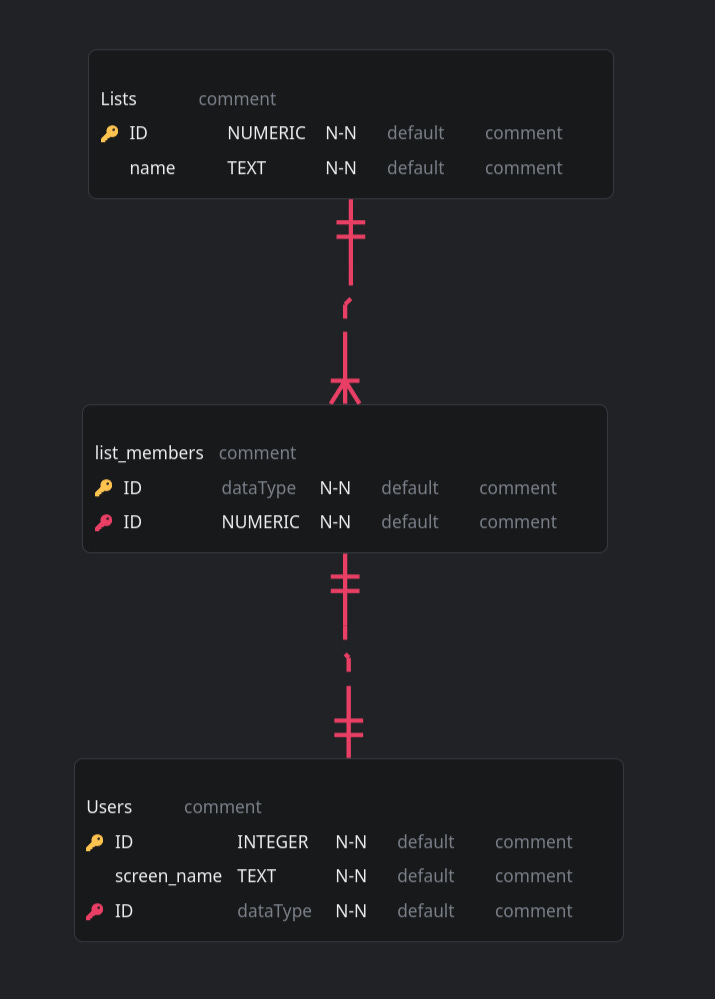
That’s complex and has no links yet. Here’s a hand drawn example of something familiar. A Twitter list has a name, an associated list of numeric IDs, and each numeric ID can be used to look up a full user object. A human would want those list members in a tabular form with all account info, a computer just needs the ID.
And here is where the fun begins, data visualization style. This is a large, complex schema from a leak that’s never been properly examined. Each blue dot is a table, the yellow dots are fields in each table. This is a little slice of an enormous visualization and there are no table to table links yet. Once there are the important tables will start to become obvious, and this is just one facet of the ERD.
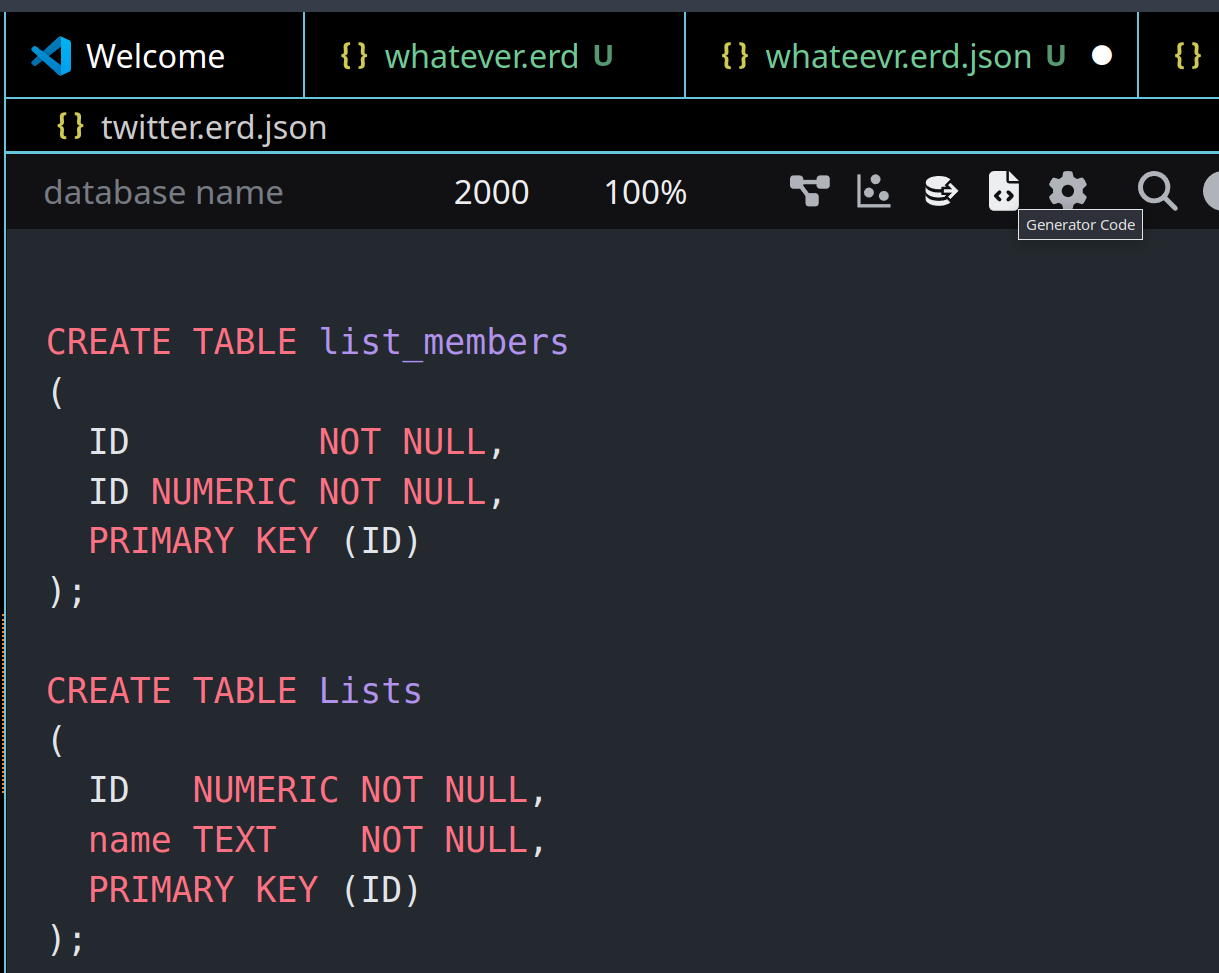
And here’s another facet - code generation.
And that code, which happens to be SQL, is the start of the information you might need to do a Datasette query … this is a simple single table example, but once we get a little smarter we’ll be doing multiple table queries, producing human readable output from database gobbledygook.
The audience for this is mostly internal, but since new people will show up and look around before deciding to reach out, this is a useful public display of capabilities.


